The 2000 First Year Physics Report
This report is based on final marks in UBC first year physics courses offered during the first term. The study includes students who graduated from B.C. schools in 2000. Students must also have Physics 12 or Physics 11 requirements fulfilled. Consequently, the sample used in this study represents about 67% of the total number of students enrolled in UBC first year physics courses. This sample is representative for studying the effect of transition from high school to university on studentsí performance in physics.
Following the initiative started many years ago by the UBC Mathematics Department ( First Year Calculus Results ), the report will compare studentsí participation and performance in UBC Physics courses by region, school and gender. Recent high school graduates from Alberta and Ontario enrolled in UBC first year physics courses are also included in the study. Since this is the first school-by-school report done by the UBC Physics and Astronomy Department, comparison with other years is not available. The purpose of this study is to inform the interested audience (students, teachers, faculty or administrators) about UBC studentsí performance in Physics courses compared to their high-school achievements.
The differences in average student performance from different schools are in most cases rather small. From experience with the Math survey we expect significant year over year variations in ranking. The present survey is an experiment. It is hoped that the information will be of interest to people involved in physics education in BC.
First Year UBC Physics courses (Term I)
A. UBC Physics courses with Mathematics 12 & Physics 12 requirements.
PHYSICS 101: Elementary Physics I.
PHYSICS 121: Physics I.
PHYSICS 153: Elements of Physics (this is a two-term course; only first term results are included in analysis)
PHYSICS 170: Mechanics I (This year, PHYS 170 was not included in analysis due to the small size of the group of students who graduated high school in 2000).
B. UBC Physics courses with Mathematics 12 & Physics 11 requirements.
PHYSICS 100: Introductory Physics.
Contents
1. Enrollment and Performance in UBC Physics Courses
2. Enrollment and Performance in UBC Physics Courses by Gender
3. Comparison of Achievements by Region and School Type
4. Comparison of Achievements by School
5. Distribution of Students by Course Profile
(ONLY includes students from
the 2000 graduating classes of BC high schools &
with Physics12 or Physics11
requirement provided)
|
Physics Course |
|
|
A standing |
Average UBC mark |
av. mark |
|
|
|
|
|
|
|
|
|
|
|
|
|
|
|
|
|
|
|
|
|
|
|
|
|
|
|
|
Table IB (Physics 11 requirement)
|
Physics Course |
|
|
A standing |
Average UBC mark |
av. mark |
|
|
|
|
|
|
|
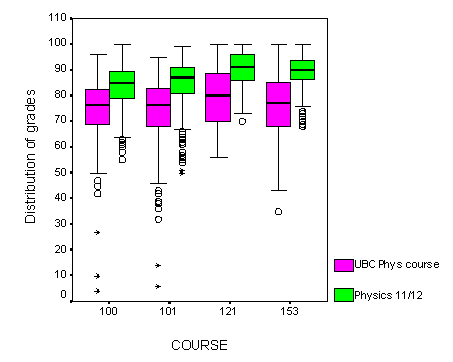
Graph I A-B: Distribution of marks in UBC and high-school physics courses

Note: The clustered box
plots offer summaries of values for separate variables. Each box contains
50% of cases and the line across the box indicates the median. The whiskers
are lines that extend from the box to the highest and lowest values, excluding
the outliers (cases with values between 1.5 and 3 box lengths from the
upper or lower edge of the box) and extremes (values more than 3 box lengths
from the box).
Click here to go back to Contents.
(ONLY includes students from
the 2000 graduating classes of BC high schools &
with Physics12 or Physics11
grades provided)
|
Physics Course |
|
|
|
standing |
Average UBC mark |
av. mark |
|
|
|
|
|
|
|
|
|
|
|
|
|
|
|
|
|
|
|
|
|
|
|
|
|
|
|
|
|
|
|
|
|
|
|
|
|
|
|
|
|
|
|
|
|
|
|
|
|
|
|
|
|
|
|
|
|
|
|
|
|
|
|
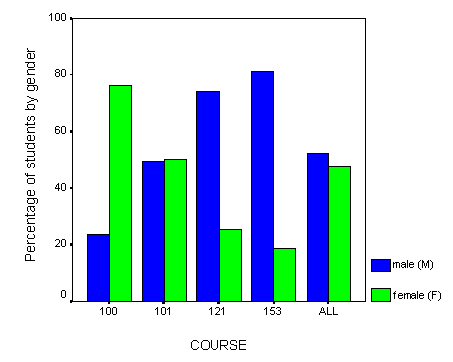
Note: There is no significant
difference between male and female studentsí performance in
the Physics courses. However, gender is a factor that introduces a significant
difference in course participation for PHYS 100 (ratio M:F about 1:3),
PHYS 121 (ratio M:F about 3:1) and PHYS 153 (ratio M:F about 4:1).
Click here to go back to Contents.
(includes ONLY students from
the graduating class of 2000 in BC high schools &
with Physics12 or Physics11
requirement)
Table II compares results by region and school type, cumulating data for courses with Physics 12 requirement, i. e. PHYS 101, PHYS 121, PHYS 153, currently included in Group A. The B.C. schools identified by region are public schools. Private and Catholic schools from all over the province form two separate groups. Vancouver schools are grouped by Vancouver east and Vancouver west. Suburban Vancouver includes Burnaby, Langley, New Westminster, Maple Ridge, Surrey, Coquitlam, Delta, North Vancouver, West Vancouver, and Richmond school districts. Vancouver Island, B. C. Interior schools and students from other provinces are grouped separately. Only regions with at least 25 students in UBC physics courses from Group A are "ranked".
Ranking procedure
The "ranking" is based ONLY on studentsí participation in Group "A" UBC courses (courses with Physics 12 requirement: PHYS 101, PHYS 121, PHYS 153).
The ranking score is determined by equally weighing ranks in these categories:
a) % passing in these courses
b) % with A standing (A-, A, A+) in these courses
c) the relative change of average grades in high school vs. UBC Physics courses.
High values of % passing, % with A standing, as well as small variation in grades would contribute to higher ranks. Regions or schools are first ranked in each category (a-c) and then a total rank is computed.
Tables also show the % of students in Group A courses vs. the total number of students in UBC physics courses, as well as Math 12 average grades. This data is not considered in ranking, but provides additional information about high school studentsí preparedness in physics and mathematics.
Table II - all courses with Physics 12 requirement
(Group A)
(the total number of students in
this sample is given in brackets)
|
|
(total no. studs) |
Passing |
Standing |
Avg. UBC mark |
|
courses |
|
| 1. Burnaby |
|
|
|
|
|
|
|
| 2. Vancouver west |
|
|
|
|
|
||
| 3. North Vancouver |
|
|
|
|
|
|
|
| 4. Vancouver east |
|
|
|
|
|
|
|
| 5. Richmond |
|
|
|
|
|
|
|
| 6. Catholic |
|
|
|
|
|
|
|
| 7. B. C. Interior |
|
|
|
|
|
|
|
| 8. Private |
|
|
|
|
|
|
|
| 9. Surrey |
|
|
|
|
|
|
|
| 10. Delta |
|
|
|
|
|
||
| 11. Coquitlam |
|
|
|
|
|
|
|
| 12.Vancouver Island |
|
|
|
|
|
|
| Ontario |
|
|
|
|
|
|
|
| Alberta |
|
|
|
|
|
|
The school-by-school Tables (III, IV, V) include ranking of schools with at least 10 students in UBC physics courses with the Physics 12 requirement (PHYS 101, PHYS 121, PHYS 153) in September 2000. Results are organized in three tables: Vancouver schools, Suburban Vancouver schools and B. C. schools outside Metropolitan Vancouver. Schools outside Metropolitan Vancouver (Table V) are not ranked, since the number of students was too small (results given in alphabetical order).
Ranking procedure
The "ranking" is based ONLY on studentsí participation in Group "A" UBC courses (courses with Physics 12 requirement: PHYS 101, PHYS 121, PHYS 153).
The ranking score is determined by equally weighing ranks in these categories:
a) % passing in these courses
b) % with A standing (A-, A, A+) ) in these courses
c) the relative change of average grades in high school vs. UBC Physics courses.
High values of % passing, % with A standing, as well as small variation in grades would contribute to higher ranks. Regions or schools are first ranked in each category (a-c) and then a total rank is computed.
Tables also show the % of students in Group A courses vs. total number of students in UBC physics courses, as well as Math 12 average grades. This data is not considered in ranking, but provides additional information about high school studentsí preparedness in physics and mathematics.
Vancouver Schools
Table III - all courses with Physics 12 requirement:
PHYS 101, PHYS 121, PHYS 153
(total number of students in UBC
Phys courses is given in brackets)
|
"ranking" |
(total no. studs) |
Passing |
Standing |
Avg. UBC mark |
av. mark |
Group A Phys courses |
|
| 1. Killarney |
|
|
|
|
|
|
|
| 2. David Thompson |
|
|
|
|
|
|
|
| 3. Gladstone |
|
|
|
|
|
|
|
| 4. Prince of Wales |
|
|
|
|
|
|
|
| 5.Sir Winston Churchill |
|
|
|
|
|
|
|
| 6. Kitsilano |
|
|
|
|
|
|
|
| 7. University Hill |
|
|
|
|
|
|
|
| 8. Eric Hamber |
|
|
|
|
|
|
|
| 9.Vancouver College |
|
|
|
|
|
|
|
| 10. Point Grey |
|
|
|
|
|
|
|
| 11. Vancouver Tech |
|
|
|
|
|
|
|
| 12. Lord Byng |
|
|
|
|
|
|
Suburban Vancouver Schools
Table IV - all courses with Physics 12 requirement
: PHYS 101, PHYS 121, PHYS 153
(total number of students in UBC
Phys courses is given in brackets)
|
"ranking" |
(total no. studs) |
Passing |
Standing |
Avg. UBC mark |
av. mark |
Phys courses |
|
| 1. R.C. Palmer |
|
|
|
|
|
|
|
| 2. Handsworth Sec |
|
|
|
|
|
|
|
| 3. Hugh Boyd Sec |
|
|
|
|
|
|
|
| 4. Charles London |
|
|
|
|
|
|
|
| 5. Burnaby North |
|
|
|
|
|
|
|
| 6. Sentinel Sec |
|
|
|
|
|
|
|
| 7. Cambie Sec |
|
|
|
|
|
|
|
| 8. Richmond Sec |
|
|
|
|
|
|
|
| 9. Seaquam |
|
|
|
|
|
|
|
| 10. Port Moody Sec |
|
|
|
|
|
|
|
| 11. Steveston Sec |
|
|
|
|
|
|
|
| 12. Burnaby South |
|
|
|
|
|
|
|
| 13. Pinetree Sec |
|
|
|
|
|
|
|
| 14. Semiahmoo |
|
|
|
|
|
|
|
| 15. New Westminster |
|
|
|
|
|
|
|
| 16. Brookswood Sec |
|
|
|
|
|
|
|
| 17. West Vancouver |
|
|
|
|
|
|
|
| 18. Delta Senior Sec |
|
|
|
|
|
|
|
| 19. North Delta |
|
|
|
|
|
|
|
| 20. J. N. Burnett Sec |
|
|
|
|
|
|
|
| 21. Gleneagle Sec |
|
|
|
|
|
|
|
| 22. Centennial |
|
|
|
|
|
|
B.C. Schools outside Metropolitan Vancouver
Table V - all courses with Physics 12 requirement
(alphabetical order)
(total number of students in UBC
Phys courses is given in brackets)
|
|
|
Passing |
Standing |
Avg. UBC mark |
av. mark |
Phys courses |
|
| Abbotsford Sr. Sec |
|
|
|
|
|
|
|
| Dover Bay |
|
|
|
|
|
|
|
| Kelowna Sec |
|
|
|
|
|
|
|
| Timberline Sec |
|
|
|
|
|
|
Distribution of Students by Course Profile and Region
(PHYS 100, PHYS101&121, PHYS153)
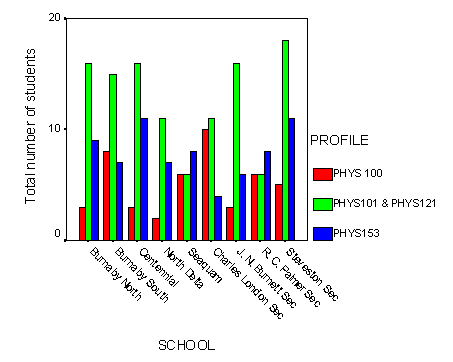
For the purpose of this analysis, the First Year Physics courses are grouped into three profiles:
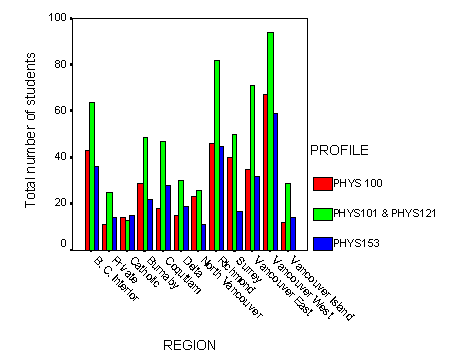
Distribution of Students by Course Profile and SchoolGraph IIB: Vancouver Schools
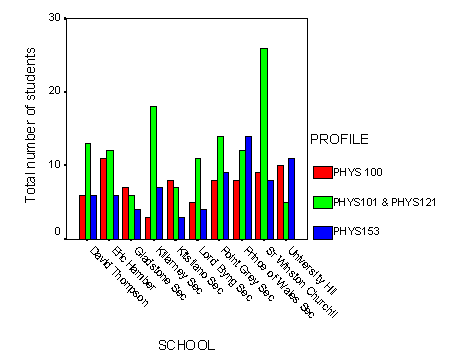
Graph IIC: Suburban Vancouver Schools
Significance of the Study
This report gives an overview of studentsí enrollment and performance in UBC First Year Physics courses. The sample used in this report is represented by high school graduates from the Class of 2000 accepted in UBC first term physics courses on the basis of high school pre-requisites (Mathematics 12, as well as Physics 12 or Physics 11 depending on the UBC physics course). This is the most common route for students to get into first year physics courses, a route that includes about 67% of the total student population in the first year & first term physics courses. Therefore, the conclusions of this study would reveal issues on physics instruction related to the transition from school to university.
Enrollment Issues
First year physics courses can be grouped into three profiles, each with specific student enrollments (Tables IA-B):
a) the gender distribution pattern for each course (Table IC):
PHYS 100, the preparatory course, has a 76% female student enrollment, which suggests a deficiency in high school science orientation for girls.
PHYS 101, a regular course, is balanced with respect to gender distribution.
PHYS 121, an Honours course, has only 26% female students, which suggests an inadequate effort by both school and university in attracting women toward more challenging courses.
PHYS 153, an applied course, has less than 19% female students.
b) course profile patterns by region and school (Graphs II)
Overall, student average enrollment in preparatory : general : applied physics courses profiles follows the ratio 27% : 47% : 26%.
This pattern is valid for almost all regions, Richmond being the most typical. However, some regions, like Coquitlam and Delta present a significant larger enrollment in applied courses, while Catholic schools show a balanced enrollment over all three profiles.
For the Vancouver schools (with more than 15 students
in UBC physics courses), one can distinguish the following untypical patterns:
- a significantly larger proportion of students
in PHYS 100 for schools like Eric Hamber, Gladstone and Kitsilano;
- a significantly larger proportion of students
in applied courses (i. e. more than in general courses) for schools like
Prince of Wales and University Hill.
For the Suburban schools (with more than 20 students
in UBC physics courses), one can distinguish the following untypical patterns:
- a significantly larger proportion of students
in PHYS 100 for schools like Charles London;
- a significantly lower proportion of students
in PHYS 100 for schools like Burnaby North,
Centennial, North Delta
and Steveston.
- comparable number of students in PHYS 100 and
general courses, but more students in applied courses for schools like R. C. Palmer and Sequam.
Performance Issues
All UBC physics courses have a large percentage of passing students: about 97%.
The average percentage of students with A standing is about 40%. PHYS 121 and PHYS 153 present higher % with A standing: 54% and 45%, respectively. Except for PHYS 100, more female than male students get A standing.
Studentsí grades in UBC physics courses are consistently lower than their corresponding grades in Physics 12 or Physics 11. The relative change is about 10-12%. There is no significant gender or course difference regarding this drop in grades.
PHYS 121 is the most homogeneous group with respect to both high school and university achievements, followed by PHYS 153 and PHYS 101.
In any of these four courses, there is no significant difference in performance by gender.
The school-by-school performance in UBC physics courses was measured by:
Issues related to the observed gender differences in enrollment & school differences in enrollment and performance can be better addressed by enhancing school-university liaison and creating links with all B. C. high schools. This implies a common effort by university and high schools.
Seemingly, high school students need to be better
informed about university physics instruction, post-secondary educational
paths in science, physics-related career options, as well as successful
efforts by university to create an inclusive instructional environment
for all students.
Click here to go back to Contents.